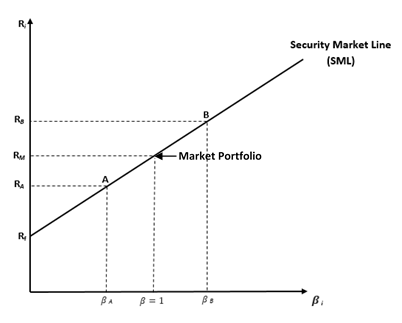
The CAPM is a model that describes the expected rate of return of an investment as a linear function of the investment’s sensitivity to changes in the market portfolio, which is known as the investment’s systematic risk, its market risk, or its beta (β).
More specifically, a stock’s expected rate of return is described by the following equation:
![]()
here ri is the expected return of stock i, rf is the risk-free rate, and RM is the expected return on the market portfolio.
As the right-hand side of this equation shows, the only quantity that differs across stocks is β. But what does this measure? One can think about β as quantifying how many “units” of risk a stock has, and the terms in brackets next to it (Rm-rf) as the “price” of each risk unit.
The key insight of the CAPM is that the price of a risk unit is the same across stocks, much like the per-unit price of oranges is the same across shoppers at a grocery story. What differs between stocks is the number of risk units, much like shoppers buying different numbers of oranges. Stocks with more risk – or higher values of β – have higher expected returns because they are more risky, and likewise, stocks with lower values of β will have lower expected returns.
The CAPM is widely used in practice. Common applications include the WACC and Portfolio performance evaluation.
As mentioned above, the CAPM is known as a single factor model because, as the equation above indicates, a stock’s risk can be summarized with a single number (i.e., just one β). But, there are alternatives to the CAPM that include multiple risk factors. Although conceptually similar – higher risk translates to higher return – what differs in multi-factor models is how risk is measured. Whereas in the case of the CAPM, risk can be fully described by the investment’s sensitivity to just one systematic factor, like the return on the market portfolio, multi-factor models such as the arbitrage pricing theory emphasize a stock’s sensitivity to multiple sources of risk.
Examples on CAPM Application
The CAPM is widely used in practice for capital budgeting purposes, for security pricing and selection, and for portfolio appraisal and construction.
The expected return generated by the CAPM is used as a cost of equity to discount cash flows when calculating a project’s NPV in capital budgeting decisions. Assume for example an electric appliances company is considering investment in the development of a new product that would require an initial investment of $300 million and is expected to generate $75 million per year starting year 1. The risk-free rate is 3%, the market returns is 8%, and the beta of the project is 1.8. The project will be financed with 100% equity. Given these assumptions, the CAPM required return on the project is = 3% + 1.8* (8% – 3%) = 12%. The NPV of the project = -300 + 75/0.12 = $325 million. The NPV is positive leading the company to accept the project.
The CAPM required return is also an effective and commonly used tool for investors to value securities and assess whether they are fairly-priced. For example, assume the stock of Denim Co. has a beta of 0.95 and the company’s next dividend of $2/share is expected to grow at 3%. The risk-free rate is 2% and the market risk premium is 4%. The required rate of return derived from the CAPM (2% + 0.95 * 4% = 4.8%) can be used in the dividend discount model to determine the fair price of Denim Co. stock: 2 / (4.8% – 3%) = $111 per share. Now suppose that an investor estimates a return of 4% from holding the Denim Co. stock, the investor can plot the estimated return against the SML to determine whether the stock is undervalued, overvalued, or properly valued and whether he should buy or short the stock. In this case, the estimated return (4%) is lower than the CAPM required return (4.8%), therefore the stock plots below the SML and has a lower return per unit of risk. The investor can conclude that the stock is overvalued and decide to sell the stock.
CFA Style Questions
Question 1
The beta of McGrow Co. is 1.2. The risk-free rate is 3.5 percent and the expected return on the market is 8 percent. What is the stock’s required return?
View Solution
Question 2
Hill’s General Corp has debt of $140 million and equity of $160 million. The company recently issued bonds at 7 percent. The beta of the company is 0.85, the risk-free rate is 5 percent, and the required return on the market is 11 percent. If the firm’s tax rate is 35 percent, the firm’s weighted average cost of capital (WACC) is closest to:
View Solution
Question 3
Lisa, an equity analyst is considering investment in a stock that a beta of 1.2 and an estimated return of 10 percent. The risk-free return is 3.0 percent and the market return of 12.0 percent. By referring to the Security Market Line (SML), Lisa would conclude that the stock is:
View Solution
Question 4
Olive King is an equity analyst at a large investment firm. He is analyzing the stock of HEY Corp. and gathered the following information:
- Expected return of HEY: 0.067
- Expected market return: 0.095
- Standard deviation of S&P 500 returns: 0.220
- Standard deviation of HEY returns: 0.326
- T-Bills rate: 0.045
- Correlation coefficient between HEY and market returns: 0.450
Based on the capital asset pricing model, King would most likely conclude that HEY is:
A. Overvalued and the investor should short the stock.
B. Undervalued and the investor should long the stock.
C. Overvalued and the investor should long the stock.
View Solution